
Cluster Analysis is one of the most used tools by Data Analysts and Data Scientists to obtain fundamental but simplified information from large amounts of data. The term cluster, in itself, indicates a group o segment of objects that have one or more characteristics in common.
In essence, taken as a reference a set of objects having a certain number of attributes, these can be used to separate the objects into any number of clusters.
Cluster Analysis VS Classification
Defined in this way, the cluster looks a lot like another famous activity of the Machine Learning family: classification. Even a class collects a number of objects with common characteristics; the difference is mainly in the technique used to define which group an object belongs to.
When you make a classification you have a series of classes (categories) known and the purpose is to understand which group an object belongs to by observing the value of its attributes. To do this, during the training phase of a classification model, we start from a set of objects whose category is already known. Through the analysis of the attributes of the objects belonging to a certain class we try to find a common pattern. The classification is, therefore, a process of supervised learning where the knowledge of a given category exists regardless of the objects that can be grouped in it.
In clustering, on the other hand, the goal is to identify a number of groups into which the objects of a set can be separated by analyzing the values of their attributes. In this case there are no predetermined classes or examples that represent them. The algorithm must be able to identify objects that “look alike” and group them together. Consequently, clustering is an unsupervised algorithm.
An example of Cluster Analysis for business
For example, let’s imagine that we want to understand which of the customers of a supermarket who have a loyalty card are receptive to offers made to stimulate the purchase of fruit and vegetables. The adjective “receptive” is of immediate impact from a communicative point of view, but it does not express a precise concept. Three different people will almost certainly have three different judgments on the subject. In addition, even if you have a client in front of you, it is not enough to look at him to understand whether he is receptive and how receptive he is. In cases like this, it is necessary to take a step forward from summary and qualitative analyses, using methodological approaches such as Clustering algorithms. These algorithms, which may or may not be Machine Learning, allow the database to be divided into an indefinite number of sets with respect to certain criteria.
In our example of receptivity in a supermarket, to perform such an analysis, it is necessary to collect some basic data about the customer such as:
- Age group
- Sex
- Recurrent purchases
- Average receipt value
- Frequency of purchase
- ..
Age group and gender are already clusters, but in this case they represent inputs to the problem to be solved. And what is the output of the algorithm? In our case it will be to associate each combination of the variables seen above with a certain level of receptivity to the offers, for example:
- Age range: 35-40 years
- Sex: male
- Recurring purchases: fresh seasonal vegetables and fruits
- Average receipt value: 30€
- Frequency of purchase: Once a week
- …
On the basis of these characteristics the user is assigned a receptivity score of 3. But what is meant by 3? Imagining a receptivity ranking, this group of customers has a more marked level than those who have 1 and 2 but less than those who have 4 or 5. In reference to this example, much is determined by the breadth and number of clusters into which the data set is divided. This is precisely one of the decisions that the analyst must make before running the algorithm. He may have the need (perhaps dictated by Marketing), to clusterize the customer base into 5 subsets, or he may want to leave the algorithm free to decide the number of clusters that best describes reality.
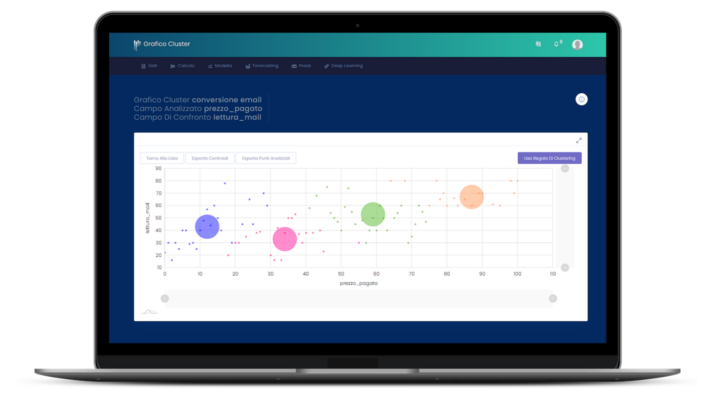
Cluster Analysis, the K-means
Following the cleaning and preparation of the input data, the analyst may choose to use algorithms that do not use Machine Learning, such as K-means, which involves defining in advance the number of Clusters that one wishes to identify. K-means is based on the identification of so-called centroids. Each centroid represents the point belonging to the space of features that averages the distances between all the data belonging to the cluster associated with it. It represents a sort of barycenter of the cluster. There are, however, some procedures, such as the Elbow Method, which involve the execution of algorithms such as K-means for an increasing number of clusters.
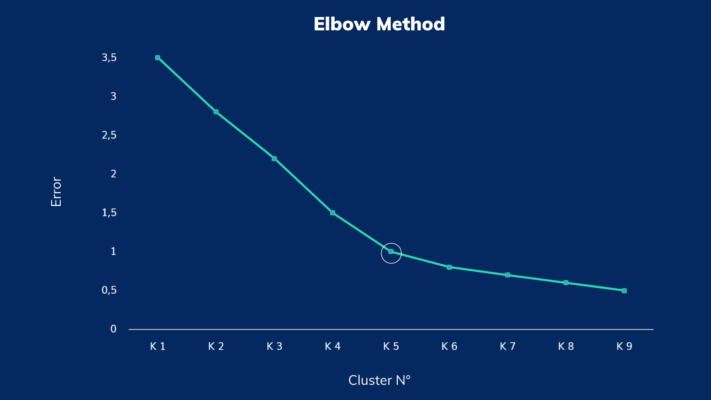
This method allows to identify the optimal number of clusters, considering the right balance between error metric and number of clusters. Similarly, one can also use Machine Learning algorithms such as Neural Networks in classificatory mode, imposing in advance the desired number of clusters.
The interesting aspect of all the approaches seen above (this is not an exhaustive exploration), is that the numerosity and boundaries of these clusters can vary over time. Through the acquisition of new data and the addition of information with a greater level of detail, it is possible to automatically determine the new number of clusters able to better describe the reality under examination.